(1)")
Portfolio scale presence & occupancy analytics

Utilization data benefits almost all stakeholders in commercial real estate, making it a cornerstone of smart buildings.
The Utilize Index
Utilize translates data from presence sensors of any kind into one common measure of utilization – the Utilize Index. The Utilize Index enables comparative analysis on asset and portfolio level in real-time or over time. Utilize allows building managers to understand and optimize the assets in a building portfolio, or to automate workflows based on real time behavior data.
Portfolio analysis
With Utilize, analyses and benefits are not limited to a single building where the right hardware has been installed, it is easily scalable to entire portfolios. The portfolio scale analysis shows the long-term financial health of the entire company as a real-time pulse or as a lasting trend. The portfolio can be used as a benchmark to see top or bottom performing business units, assets or teams and enabling excess performance to be compared to the general company or the market in general. Portfolio level insights in Utilize are generated from presence sensors usually already installed in HVAC, lights and IoT systems.
Comparative analysis
Filters and comparison analysis of the Utilize Index empowers commercial real estate professionals to present data in different views, informing a range of use cases from space management, health, maintenance and more. Utilize enables tailoring staffing, HVAC and other services to actual and real-time tenant utilization rather than scheduled usage.
No sensor costs
Utilize can be run on presence sensors which in most cases are installed as a part of HVAC, access systems or other solutions. As a result, there is no investment cost in presence sensors to start using Utilize.
”The timeline graph in Utilize was a real eye-opener for me as a decision-maker. It challenged assumptions about how our facilities are used and provided me with data to test hypotheses. Most importantly, the aggregated data in the graph was presented in a way that made it easy to understand and analyze.”
Christian Fredrixon, CIO

Included features
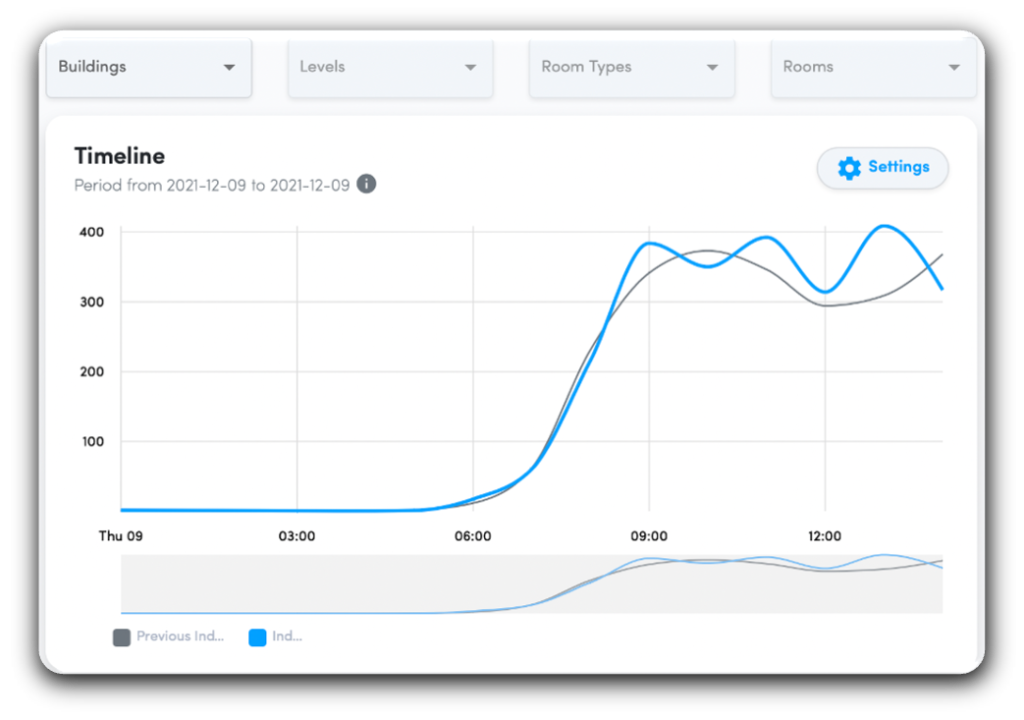
Timeline
✓
Weekly Heatmap
✓
Portfolio analysis
✓
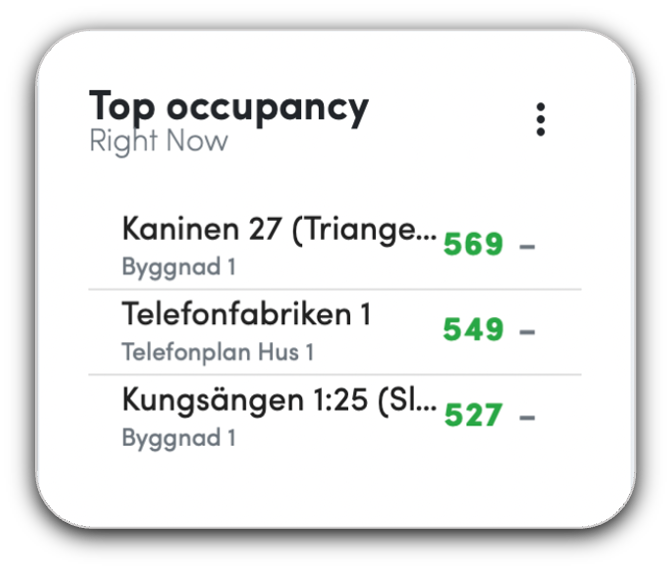
Top Occupancy
✓
Room Drill down
✓
Timeline
✓
✓
✓
Weekly Heatmap
✓
✓
✓
Portfolio analysis
✓
✓
✓
Top Occupancy
✓
✓
✓
Room Drill down
✓
✓
✓
Use cases supported by Utilize
Power
- Optimize the building power usage based on real-time and typical utilization
- HVAC weekly pattern allows using the index as input for how to set up HVAC
Maintenance
- Use real-time utilization data as input to work orders for staffing and cleaning schedules and maintenance
Space usage
- Optimize space usage and floor planning for increased productivity and communication using utilization data of staff and visitors.
Hygiene
- Comply with social distancing guidelines by monitoring occupancy levels
- Provide tenants with utilization data so that they can base their decision on it
Features of Utilize
Timeline
A line chart that provides historical data of the Utilize Index for a selected asset type (room, floor, building or specific area) and compares it to an equivalent previous period. The timeline can be used to perform trend analysis, year-on-year analysis and baseline benchmarking for a time period or a specific point in time.
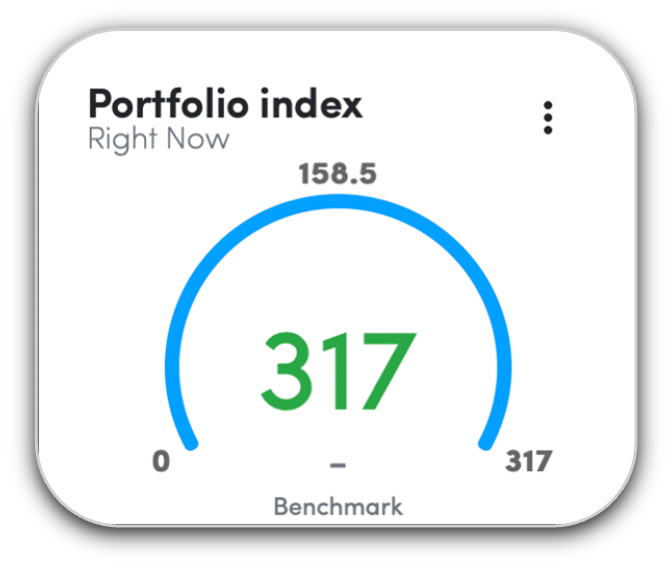
Portfolio analysis
Show the Utilize Index, the level of utilization, across the whole portfolio, how the current Utilize Index compares to normal utilization (Utilize Index 100) and the benchmark value of the Utilize Index for an equivalent previous period. The Portfolio analysis functionality enables utilization to be used as a health metric for properties and enables portfolio benchmarking.
Top occupancy
This widget provides three metrics: Highlights the most utilized buildings in the portfolio, provides the current Utilize Index compared to normal utilization and the benchmark value, across the portfolio, adjusted by a selected date.
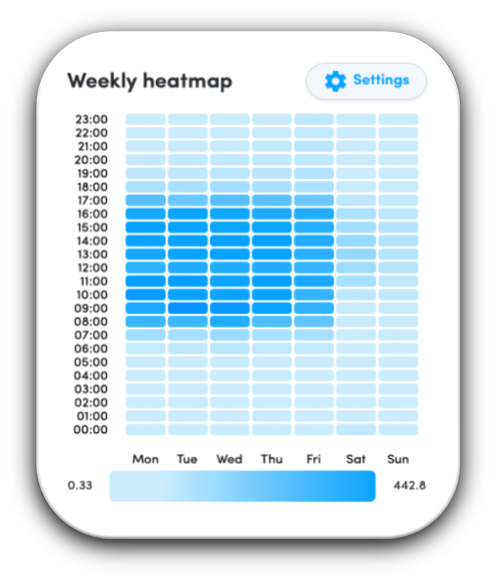
Heatmap over a week
A heatmap showing the average utilization pattern of a selected asset or a group of assets, hourly by the day of the week.
Drill down
Filter utilization data by time, asset type (room, floor, building, portfolio, region) or a particular space in a portfolio. Utilize also enables comparative analysis across time and asset type, including benchmarking functionality.